
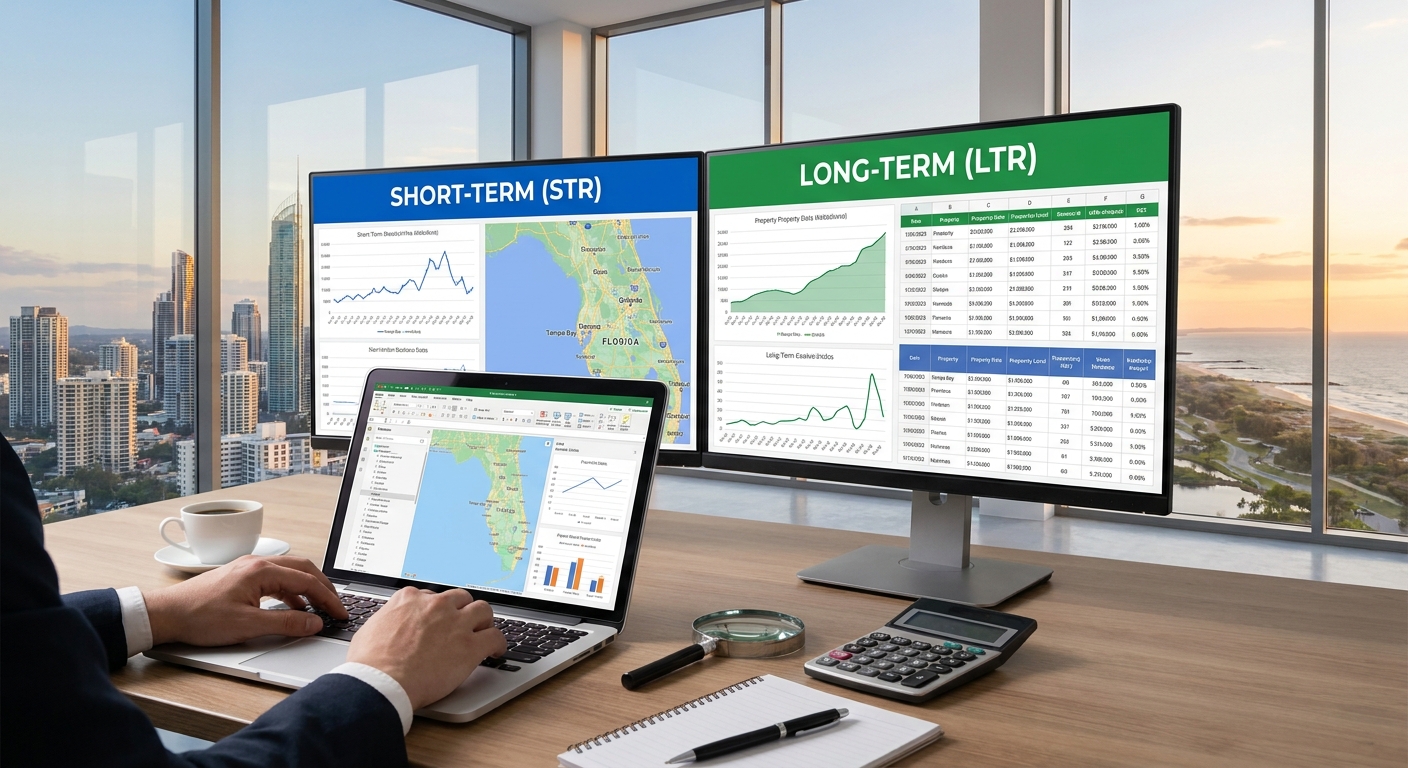
Evaluating capital deployment across Tampa Bay and Central Florida requires looking past gross revenue projections and underwriting true Net Operating Income (NOI). Both short-term rentals (STR) and long-term rentals (LTR) present distinct return profiles across submarkets like Pinellas, Hillsborough, Polk County, Orlando, and Ocala. Choosing between the two comes down to debt service limits, operational overhead, local ordinance risks, and target cash-on-cash returns.
Underwriting Long-Term Rentals (LTR)
Long-term rentals offer predictable cash flows, lower turnover costs, and streamlined management. In Central Florida submarkets like Polk County (Lakeland, Winter Haven) and Ocala, lower acquisition entry points allow for stronger day-one cap rates compared to coastal metro cores.
When underwriting an LTR in these markets, standard expense assumptions generally consume 35% to 45% of gross annual income:
- Property Management: 8% to 10% of collected rent.
- Vacancy Allowance: 5% to 7% (roughly 2 to 3 weeks per year).
- Maintenance and Capital Expenditures (CapEx): 10% to 12% depending on HVAC age, roof condition, and plumbing.
- Property Taxes and Insurance: Varies significantly by county; coastal Pinellas carries substantially higher flood and windstorm premiums than inland Hillsborough or Polk.
For example, a $350,000 single-family asset in Polk County renting for $2,300 per month generates $27,600 in gross annual rent. Factoring in a conservative 40% operating expense ratio yields an NOI of $16,560—representing a net cap rate of approximately 4.73%. With 25% down ($87,500) at prevailing mortgage rates, debt service will dictate whether the asset yields immediate positive cash flow or functions primarily as an equity-growth play.
Underwriting Short-Term Rentals (STR)
Short-term rentals can yield 1.5x to 2.5x the gross top-line revenue of a traditional LTR in high-demand pockets. However, operating expenses consume a much higher percentage of gross receipts, typically running between 50% and 60%.
Key expense items to model for STRs in Tampa Bay and Central Florida include:
- Professional STR Management: 18% to 25% of gross booking revenue.
- Utilities and Internet: 100% paid by the owner ($350 to $600+ monthly).
- Platform Fees and Merchant Processing: 3% to 5%.
- Repairs, Linen Replacement, and Supplies: Higher wear-and-tear due to frequent turnover.
- Specialized Insurance: Commercial liability and vacation rental endorsement add-ons.
Consider the same $350,000 property footprint optimized for STR performance in a permissive submarket. If the property averages 68% occupancy at a $180 Average Daily Rate (ADR), gross annual revenue reaches roughly $44,676. Applying a 55% expense ratio leaves an NOI of $20,104, reflecting a 5.74% net cap rate. While the net yield outperforms the LTR model by roughly 100 basis points, the volatility and capital expenditure reserve requirements increase substantially.
Regulatory Landscape and Municipal Constraints
Yields cannot be evaluated without accounting for localized legal constraints across Central Florida:
- Pinellas County: Unincorporated areas permit short-term rentals, but municipalities like St. Petersburg enforce strict minimum stay rules (e.g., maximum three rentals per 365-day period in residential zones) unless properly zoned commercial.
- Hillsborough County & City of Tampa: Municipal codes enforce strict residential zoning rules, actively fining non-compliant operators in residential neighborhoods.
- Orlando & Orange County: STRs are restricted in standard residential neighborhoods, directing investor capital toward purpose-built vacation resort communities along the Osceola/Polk border zones (e.g., Davenport, Kissimmee).
- Ocala & Polk County: Lower acquisition costs and more flexible zoning in select pockets provide reliable baseline returns for traditional buy-and-hold strategies.
Capital Allocation Strategy
To determine where to deploy equity, compare both strategies against your cost of capital:
- Choose Long-Term Rentals if your priority is predictable monthly cash flow, low regulatory risk, lower management friction, and long-term debt paydown in growth corridors like Polk County, Hillsborough, or Ocala.
- Choose Short-Term Rentals if you require higher gross yield, have cash reserves to absorb seasonal shifts (e.g., Florida's slower late-summer months), and acquire assets in legally protected tourist corridors or commercially zoned pockets.
At ANEW Collective, we evaluate deals through clear mathematical underwriting rather than projected gross estimates. Having navigated over 1,000 real estate transactions across Tampa Bay and Central Florida, our team helps investors model exact operating expenses, property tax adjustments, and local zoning laws before placing capital.